Clementine (1994)
Early Unmanned NASA Craft | Mercury |Gemini | Apollo |
Clementine | Lunar Prospector | Hubble
Space Telescope

Clementine was a joint project between the Ballistic Missile
Defense Organization (BMDO) and NASA.
The objective of the mission was to test sensors and spacecraft components under
extended exposure to space and to make scientific observations of the moon and
the near-Earth asteroid1620 Geographos.
The Geographos observations were not made due to a malfunction
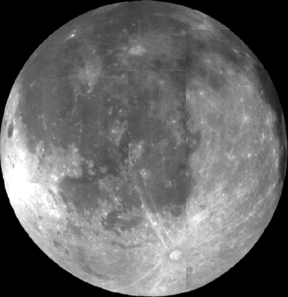
in the spacecraft. The lunar observations made included imaging at various wavelengths
in the visible as well as in ultraviolet and infrared, laser ranging altimetry,
gravimetry, and charged particle measurements. These observations were for the
purposes of obtaining multi-spectral imaging the entire lunar surface, assessing
the surface mineralogy of the moon, and obtaining altimetry from 60° N to
60° S latitude and gravity data for the near side.
There were also plans to image and determine the size, shape,
rotational characteristics, surface properties, and cratering statistics of Geographos.
The mission had two phases. After two Earth flybys, the lunar
insertion was achieved approximately one month after launch. Lunar mapping took
place over approximately two months, in two parts. The first part consisted of
a five hour elliptical polar orbit with a periapsis of about 400 km at 30° S
latitude and an apoapsis of 8300 km. Each orbit consisted of an 80 minute lunar
mapping phase near periapsis and 139 minutes of downlink at apoapsis. After one
month of mapping, the orbit was rotated to a periapsis at 30° N latitude,
where it remained for one more month. This allowed global imaging and altimetry
coverage from 60° S to 60° N over a total of 300 orbits.
After a lunar/Earth transfer and two more Earth flybys, the
spacecraft was to head for Geographos, arriving three months later for a flyby,
with a nominal approach closer than 100 km. Unfortunately, on May 7, 1994, after
the first Earth transfer orbit, a malfunction aboard the craft caused one of
the attitude control thrusters to fire for 11 minutes, using up its fuel supply
and causing Clementine to spin at 80 rpm. Under these conditions, the asteroid
flyby could not yield useful results, so the spacecraft was put into a geocentric
orbit passing through the Van Allen radiation belts to test the various components
on board. The mission ended in June 1994, when the power level onboard dropped
to a point where the telemetry from the spacecraft was no longer readable.
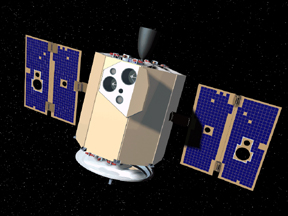 The
spacecraft was an octagonal prism 1.88 m high and 1.14 m across with two solar
panels protruding on opposite sides parallel to the axis of the prism. A high-gain
fixed dish antenna was at one end of the prism, and the 489 N thruster at the
other end. The sensor openings were all located together on one of the eight
panels, 90° from the solar panels, and protected in flight by a single sensor
cover. The
spacecraft was an octagonal prism 1.88 m high and 1.14 m across with two solar
panels protruding on opposite sides parallel to the axis of the prism. A high-gain
fixed dish antenna was at one end of the prism, and the 489 N thruster at the
other end. The sensor openings were all located together on one of the eight
panels, 90° from the solar panels, and protected in flight by a single sensor
cover.
The spacecraft propulsion system consisted of a non-propellant
hydrazine system for attitude control and a bi-propellant nitrogen tetraoxide
and monomethyl hydrazine system for the maneuvers in space. The bi-propellant
system had a total capability of about 1900 m/s with about 550 m/s required for
lunar insertion and 540 m/s for lunar departure. Attitude control was achieved
with 12 small attitude control jets, two star tracker cameras, and two inertial
measurement units.
The spacecraft was three-axis stabilized in lunar orbit via
reaction wheels with a precision of 0.05° in control and 0.03° in knowledge.
Power was provided by gimbaled, single axis, GaAs/Ge solar
panels which charged a 15 A-hr, 47-W hr/kg Nihau (Ni-H) common pressure vessel
battery.
Spacecraft data processing was performed using a MIL-STD-1750A
computer (1.7 million instructions per sec) for save mode, attitude control,
and housekeeping operations, a RISC 32-bit processor (18 million ips) for image
processing and autonomous operations, and an image compression system provided
by the French Space Agency CNES. A data handling unit sequenced the cameras,
operated the image compression system, and directed the data flow. Data was stored
in a 2 Gbit dynamic solid state data recorder.
Charged Particle Telescope (CPT)
- This was designed to measure the flux and spectra of energetic protons (3-80
MeV) and electrons (25-500 KeV). The primary goals of the investigation were
to:
- study the interaction of Earth's magnetotail and interplanetary shocks
with the moon
- monitor the solar wind in regions far removed from other spacecraft as
part of a multi mission coordinated study
- measure the effects of incident particles on the operating ability of the
spacecraft solar cells and other sensors
- In order to meet the stringent limit on the mass of the instrument (<1
kg), it was implemented as a single element telescope. The telescope had a 10° half-angle
field of view. The detector, a silicon surface-barrier type with an area of
100 mm2 and a thickness of 3 mm, was shielded so as to prevent protons
below 30 MeV from reaching it from directions other than via the aperture. The
aperture was covered by a very thin foil to prevent light impinging on the detector
and generating noise. The signal from the detector was broken up into nine channels,
the lowest six dedicated to electron detection and the highest three to protons
and heavier ions.
Ultraviolet / Visible CCD Camera (UV/Vis)
- This was designed to study the surfaces of the moon and asteroid Geographos
at five different wavelengths in the ultraviolet and visible spectrum. This
experiment yielded information on the petrologic properties of the surface material
on the moon, as well as giving images useful for morphologic studies and cratering
statistics. Most images were taken at low sun angles,
which is useful for petrologic studies but not for observing morphology.
- The sensor consisted of a catadioptric telescope with an aperture of 46 mm
and fused silica lenses focused onto a coated Thompson CCD camera with a band
pass of 250-1000 nm and a six-position filter wheel. The wavelength response
was limited on the short wavelength end by the transmission and optical blur
of the lens, and on the long end by the CCD response.
- The CCD was a frame transfer device which allowed three gain states (150,
350, and 1000 electrons/bit). Integration times varied from 1 to 40 ms depending
on gain state, solar illumination angle, and filter. The filter center wavelengths
(and band pass widths (FWHM)) were 415 nm (40 nm), 750 nm (10 nm), 900 nm (30
nm), 950 nm (30 nm), 1000 nm (30 nm), and a broad-band filter covering 400-950
nm. The field of view was 4.2°x5.6°, translating to a cross-track width
of about 40 km at a nominal 400 km lunar altitude. The image array was 288x384
pixels. Pixel resolution varied from 100-325 m during a single orbit mapping
run at the moon. At Geographos the pixel resolution would have been 25 m at
the 100 km closest approach, giving an image size about 7x10 km. The camera
took twelve images in each 1.3 s image burst, which occurred 125 times over
the 80 minute mapping span during each five hour lunar orbit.
- The moon's surface was covered completely during the two month lunar mapping
phase of the mission. The dynamic range was 15,000. The signal-to-noise ratio
varied from 25-87 depending on the surface albedo and phase angle, with a relative
calibration of 1% and an absolute calibration of 15%.
Near-Infrared CCD Camera (NIR)
- This was designed to study the surfaces of the moon and the near-Earth asteroid
1620 Geographos at six different wavelengths in the near-infrared spectrum.
This experiment yielded information on the petrology of the surface material
on the moon.
- The camera consisted of a catadioptric lens which focused on a mechanically-cooled
(to a temperature of 70 K) Amber InSb CCD focal-plane array with a band pass
of 1100-2800 nm and a six-position filter wheel. The filter center wavelengths
(and band pass widths (FWHM)) were: 1100 nm (60 nm), 1250 nm (60 nm), 1500 nm
(60 nm), 2000 nm (60 nm), 2600 nm (60 nm), and 2780 nm (120 nm). The aperture
was 29 mm with a focal length of 96 mm. The field of view was 5.6°x5.6°,
giving a cross-track width of about 40 km at a nominal 400 km lunar altitude.
- The moon had complete mapping coverage during the two month lunar phase of
the mission. The image array is 256x256 pixels, and pixel resolution varied
from 150-500 m during a single orbit mapping run at the moon. (At Geographos
the pixel resolution would have been 40 m at closest approach, giving an image
size about 10x10 km.) The camera took twelve images in each 1.3 sec image burst,
which occurred 75 times over the 80 minute mapping span during each five hour
lunar orbit. The dynamic range was 15,000. The signal-to-noise ratio varied
from 11-97 depending on the surface albedo and phase angle, with a relative
calibration of 1% and an absolute calibration of 30%. The gain varied from 0.5
to 36.
Long-Wavelength Infrared Camera (LWIR)
- This was designed to image dark side features on both the moon and the near-Earth
asteroid 1620 Geographos in the thermal infrared spectrum, and to allow measurement
of thermal properties of material on both bodies, from which an assessment of
regolith characteristics can be made.
- The LWIR camera consisted of a catadioptric lens with an aperture of 131
mm focused onto a mechanically-cooled (to 65 K) Amber HgCdTe focal-plane array
(FPA). The FPA had a broad-band response from wavelengths of 8000-9500 nm. The
focal length was 350 mm. The field of view was 1°x1°, translating to
a width of about 17.5 km at 1000 km distance. The image array was 128x128 pixels,
with each pixel being 50 µm on a side, giving a pixel resolution varying
from about 55-136 m/pixel. (At Geographos the pixel resolution would have been
about 14 m for a 100 km closest approach, giving an image width of about 1750
m.)
- At the moon, the camera was used primarily for night side imaging near the
poles, where it could take 660 images over a ten minute pass each five hour
orbit. It was also used for selected high-resolution images in other areas.
The camera imaged approximately 0.4% of the moon's surface (both poles from
85-90°) over the two month lunar phase of the mission. The nominal signal-to-noise
ratio was 950, with a relative calibration of 1% and an absolute calibration
of 30%, and a gain ranging from 0.5 to 36.
Laser Image Detection and Ranging (LIDAR) System
- This experiment was designed to measure the distance from the spacecraft
to a point on the surface of the moon. This allowed an altimetric map to be
made, which can be used to constrain the morphology of large basins and other
lunar features, study stress and strain and flexural properties of the lithosphere,
and can be combined with gravity to study the density distribution in the crust.
The experiment was also designed to measure distances to the surface of Geographos.
- The LIDAR ranging system consisted of a 180 mJ, 1064 nm wavelength Nd-YAG
(Yttrium-Aluminum-Garnet) laser transmitter which transmitted pulses to the
lunar surface. The laser produced a pulse with a width less than 10 ns. At 1064
nm wavelength, the pulse had an energy of 171 mJ with a divergence less than
500 µrad. At 532 nm, it had a 9 mJ pulse with a 4 mrad divergence.
- The reflected pulse traveled through the High-Resolution Camera telescope,
where it was split off by a dichroic filter to a silicon avalanche photodiode
detector. The detector was a single 0.5x0.5 mm cell SiAPD receiver with a field
of view of 0.057°2. The laser had a mass of 1250 g, the receiver
was housed in the 1120 g HIRES camera. The travel time of a pulse gave the range
to the surface. The LIDAR memory could save up to six return detections per
laser firing, with a threshold set for the best compromise between missed detections
and false alarms. The returns were stored in 39.972 m range bins, equal to the
resolution of the 14-bit clock counter.
- The LIDAR has a nominal range of 500 km, but altimetric data was gathered
for altitudes up to 640 km, which allowed coverage from 60° S to 60° N
by the end of the lunar phase of the mission. The vertical resolution is 40
m, and the horizontal spot resolution is about 100 m. The across track spacing
of the measurements at the equator was about 40 km. One measurement was made
each second over a 45 minute period during each orbit, giving an along track
spacing of 1-2 km.
High-Resolution Camera (HIRES)
- This consisted of a telescope with an image intensifier and a frame-transfer
CCD imager. The imaging system was designed to study selected portions of the
surfaces of the moon and the near-Earth asteroid 1620 Geographos. This experiment
allowed the detailed study of surface processes on the moon and, combined with
spectral data, allowed high-resolution compositional and geologic studies.
- The imager was an intensified Thompson CCD camera with a six position filter
wheel. The set of filters consisted of a broad-band filter with a band pass
of 400 to 800 nm, four narrow-band filters with center wavelengths (and band
pass width (FWHM)) of 415 nm (40 nm), 560 nm (10 nm), 650 nm (10 nm), and 750
nm (20 nm), and 1 opaque cover to protect the image intensifier. The field of
view was 0.3°x0.4°, translating to a width of about 2 km at a nominal
lunar altitude of 400 km. The image array is 288x384 pixels, (pixel size of
23x23 micrometers) so the pixel resolution at the moon was 7-20 m depending
on the spacecraft altitude. (At Geographos the resolution would have been <5
m at closest approach.)
- The clear aperture was 131 mm and the focal length was 1250 mm. The nominal
imaging rate was about 10 frames/sec in individual image bursts covering all
filters at the moon. The high resolution and small field of view only allowed
coverage of selected areas of the moon, in the form of either long, narrow strips
of a single color or shorter strips of up to four colors. The instrument has
a signal to noise ratio of 13 to 41 depending on the albedo and phase angle,
with a 1% relative calibration and a 20% absolute calibration, and a dynamic
range of 2000.
- The telescope of the High-Resolution Camera was shared by the LIDAR instrument.
The 1064 nm laser return was split to the LIDAR receiver (an avalanche photodiode
detector) using a dichroic filter.
Star Tracker Cameras
- The craft was equipped with two star tracker cameras. Each camera consisted
of a knife-edge baffle vane and a lens mounted to the CCD camera housing. Both
cameras were located at one end of the spacecraft, near the main thruster. The
main purpose of the star tracker cameras were to image the background stars
in order to provide attitude determination for the spacecraft. This was done
by comparing stellar images to an onboard star catalog to establish absolute
angular references for navigation. However, images of the Earth and moon for
scientific purposes could also be obtained.
- The cameras had a wide field of view (28°x43°), entrance pupils 14
mm in diameter, band pass filters of 0.4 to 1.1 µm, and focal lengths
of 17.5 mm. In each camera, a concentric optics design with a fiber optic field
flattener coupled the image surface to a Thompson CCD focal plane array of 384x576
pixels, each pixel being 23 x 23 µm in size. Only broadband operation
was available, and the line-transfer electronic shuttering limited imaging to
dim targets such as the lunar surface illuminated by earthshine.
S-Band Transponder Doppler Gravity Experiment
- The gravity experiment used measurements of perturbations in the motion of
the spacecraft to infer the lunar gravity field. Clementine was equipped with
an S-band microwave transponder and 2 S-band omni-directional high-rate antennas
which were used for tracking by the NRL tracking station in Pomonkey, MD, and
the NASA Deep Space Network. The frequency of the S-band transmission was measured
every 10 sec, and the Doppler shift would give the relative velocity of the
spacecraft towards or away from the Earth. Accelerations were calculated from
changes in the velocity, and after accounting for the orbit, relative motions
of Earth and moon, and Earth and solar gravity, these accelerations are converted
to lunar gravity effects on the spacecraft.
- The calculated lunar gravity field can be used to model subsurface lunar
structure. The Pomonkey station could measure the velocity to an accuracy of
3 mm/sec, while the Deep Space Network stations could achieve about 0.3 mm/sec.
Tracking was not possible on most of the lunar far side (120° to 240° long,
-45° to 45° lat), when the moon was between the spacecraft and the Earth.
In all, over 361,000 observations were made, approximately 57,000 at less than
1000 km altitude.
Bistatic Radar Experiment
- This made use of the radio transmitting equipment aboard Clementine to search
the moon's polar regions for evidence of ice in permanently shadowed craters.
The basic method of bistatic radar involves a spacecraft transmitting a radio
signal at a point on the target body. Reflections of these signals from the
target are received on Earth. Properties of the received reflections can be
interpreted to give information on the target surface.
- In this experiment, the Clementine spacecraft transmitted an unmodulated
S-band right-circularly polarized signal through the 1.1 m high-gain antenna.
The signal had a frequency of 2.273 GHz (13.19 cm wavelength) and net power
of about 6 W. The high gain antenna had a half-power half-beamwidth of 4.0°.
Reflections were received on Earth by the 70 m antennae of the Deep Space Network
(DSN) at Goldstone (United States), Madrid (Spain) and Canberra (Australia).
During these passes, the lunar axial tilt toward Earth at the DSN stations was
4.5-5.5°. The experiment can be done when the target and DSN receiver are
coplaner with the spacecraft orbital plane. The bistatic radar experiment was
performed for the lunar south pole during orbits 234, 235, 236, and 237 on April
9-10, 1994 (received at Goldstone, Madrid, and Canberra). Observations of the
north pole were made on orbits 299, 301, and 302 on April 23-24, 1994 (received
at Madrid and Canberra). Systematic errors made the results from orbits 236,
237, and 299 unusable.
- The properties of the reflected radio signal which are of particular interest
in the search for water ice and other frozen volatiles are the echo magnitude
and the sense of polarization. The echo magnitude, or amplitude of reflectivity,
is higher for frozen volatiles than for typical silicate rocks. Total internal
reflection, characteristic of volatile ices, tends to preserve the original
sense of circular polarization, in this case right-circular polarization, or
RCP, in the reflected signal.
- There is also a detection, known as a coherent backscatter opposition effect,
which can be made as the spacecraft-target-receiver angle approaches zero, which
may indicate scattering centers embedded in ice. Results of the experiment showed
a significant RCP to LCP (left-circular polarization) ratio enhancement on orbit
234 over the south pole and a coherent backscatter opposition effect, possibly
indicative of volatile ices (presumably well-mixed with soil and dust) in the
permanently shadowed craters in this region. However, other scattering mechanisms,
such as roughness, can not be ruled out as the cause of these results. The other
orbits did not show statistically significant RCP/LCP enhancements.
|
| Also Called |
Deep Space Program Science Experiment (DSPSE) |
| Launch Date |
January 25, 1994 at 16:34:00 UTC |
| Launch Vehicle |
|
| Mass |
227 kg |
| Power Output |
360 W |
|
| Experiments: |
Name
|
Mass (kg)
|
Power Consumption (W)
|
Principal Investigator
|
| Charged Particle Telescope (CPT) |
0.21
|
|
Dr. Eugene M. Shoemaker |
| Ultraviolet / Visible CCD Camera (UV/Vis) |
0.41
|
4.5
|
Dr. Eugene M. Shoemaker |
| Near-Infrared CCD Camera (NIR) |
1.92
|
11
|
Dr. Eugene M. Shoemaker |
| Long-Wavelength Infrared Camera (LWIR) |
2.1
|
13
|
Dr. Eugene M. Shoemaker |
| Laser Image Detection and Ranging (LIDAR) System |
2.37
|
6.8
|
Dr. Eugene M. Shoemaker |
| High-Resolution Camera (HIRES) |
1.12
|
9.5
|
Dr. Eugene M. Shoemaker |
| Star Tracker Cameras |
5.8
|
4.5
|
Dr. Eugene M. Shoemaker |
| S-Band Transponder Doppler Gravity Experiment |
8.27
|
|
Dr. Eugene M. Shoemaker |
| Bistatic Radar Experiment |
13.6
|
|
Dr. Eugene M. Shoemaker |
|