
|
|
|
Magellan (1989-1994) Pioneer | Mariner | Viking | Voyager | Magellan | Pathfinder | Galileo | Mars Global Surveyor
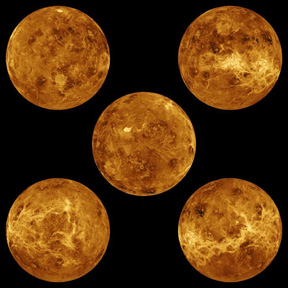
Overview Magellan was a radar mapping mission to Venus, designed as a follow-up on the Pioneer Venus mission. It was launched in 1989, arrived in 1990, and communication with the craft was lost in 1994. This was a low-budget mission, so many of the parts of the probe were actually spares from such craft as Galileo, Viking, Voyager, Mariner, Skylab, Ulysses, and the space shuttle. The total cost of the mission through 10/29/91 was $551 million, consisting of $287 million for the spacecraft, $120 million for the radar system, $49 million for launch and operations through the first 30 days, and $95 million for mission operations and data analysis through 10/29/91. The approximate additional cost of operations and analysis through the end of the mission (10/29/91 to 10/12/94) was $130 million, bringing the overall cost to roughly $680 million. Mission There were four primary objectives for this mission:
Magellan was launched on May 4, 1989, and it arrived at Venus on August 10, 1990. At arrival, it was moved into a near-polar elliptical orbit with a periapsis of 294 km at 9.5° N. From there, it began its objectives, with the mapping accomplished with a synthetic aperture radar (SAR). The mission was divided into "cycles," with each cycle lasting 243 days (one Venus day from Magellan's orbit). The cycles and their dates were as follows:
After the fifth cycle was completed, the Windmill experiment was started. This involved the solar panels being tilted in a manner so that the atmospheric drag of Venus would apply a torque that would spin the craft. The point was to measure the resultant spin of the craft in order to give information about the atmospheric density at different altitudes. Magellan was placed into a suicide descent with Venus on October 11, 1994, and plunged into the atmosphere. Radio contact with Magellan was lost on October 12, 1994, and it is presumed that the craft burned in the atmosphere by October 14. Magellan succeeded in mapping over 99% of the surface, with 98% of the surface at resolutions better than 100 m, and many areas were imaged multiple times. This is resolution ten times better than that accomplished by the Soviet Venera 15 and 16 missions. Craft
Behind the dish was a rectangular section containing the radar sensor electronics, reaction wheels, and batteries. Behind this section lay a decahedral bus that included the solar panel array, star scanner, a medium-gain antenna, the on-board computer, and two tape recorders. Behind the bus lay the propulsion module. The two 5.8 m solar panels were used for powering the spacecraft and charging the spacecraft's nickel-cadmium batteries. These batteries provided the 28 V of power needed during solar occultation to allow normal spacecraft operations. Pointing control was maintained through the use of three electrically powered, orthogonal reaction wheels. Large-scale orbital corrections, both in transit to Venus as well as after orbital insertions, was accomplished through the use of a monopropellant (hydrazine) thruster system. The thrusters were also used to permit desaturation of the momentum wheels. The coherent X- and S-band radio subsystem was used for communications as well as by the gravity field experiment. Experiment Summary Synthetic Aperture Radar (SAR) The purpose of this experiment was to obtain radar images as well as altimetry and radiometry measurements over the majority of Venus' surface. The radar system used the 3.7 m diameter high-gain antenna for synthetic aperture radar (SAR) observations and radiometry. A smaller, fan-beam antenna was used for the altimetry measurements. The antennae operated at a wavelength of 12.6 cm and shared common electronics. Between SAR bursts, pulses from the altimeter were transmitted toward the planet's surface. Radiometer data were also interleaved between the SAR bursts by having the high-gain antenna in a passive mode during which it measured the amount of radiated thermal microwave energy from the surface. Calibration of the radiometer was performed using an internal source. Thermal noise sources (e.g. the radar sensor, antenna, and cabling) were removed by making physical temperature measurements.
Mapping took place during a 37.2 minute period centering around periapsis with data transmitted during the time around apoapsis. This resulted in imaging swaths of approximately 25 km by 17,000 km which could then be combined to create a map of Venus' surface. When the radar data was combined with altimeter data, a three-dimensional surface map could be created. The radiometer data were used to determine the electrical conductivity and composition of the surface. Gravimetry The purpose of the experiment was to determine the gravity field and density distribution of Venus. This was accomplished by tracking perturbations of the spacecraft's orbit. The coherent X- and S-band radio subsystem was used in coordination with the receiving stations of the NASA Deep Space Network to monitor these perturbations. Although such observations could be made throughout the mission, high-resolution data could be obtained only near periapsis. Because of this and the fact that this experiment required that the high-gain antenna be pointed toward Earth during the measurements, the gravimetry and radar observations were incapable of operating simultaneously. Therefore, the radar mapping occupied the first three cycles of the mission with the final two cycles dedicated to the gravimetry observations. During this period measurements were made over a substantial fraction of the planet. Magellan Radio Science Occultation Experiment This made use of measurements of radio transmissions through the Venus atmosphere to Earth to determine characteristics of the atmosphere at different altitudes. The first of these experiments was done on October 5 and 6, 1991 (orbits 3212-3214). More experiments were done intermittently until October 12, 1994. Radio occultation occurs when Earth, as viewed by the spacecraft, is seen through - occulted by - the Venus atmosphere. In this experiment, the spacecraft modulation was switched off and continuous wave signals were transmitted by the spacecraft along the boresight of the high-gain antenna with linear polarization at 2.298 GHz (S-band, or 13 cm) and with circular polarization at 8.415 GHz (X-band, or 3.5 cm). Signals could be received coherently in both right- and left- circular polarizations at both wavelengths when a 70-m antenna was used at the Deep Space Network station. When a 34 m antenna was used, only a single polarization at each wavelength could be received -- in some cases, only one wavelength was captured. To ensure that the frequency was stable, a reference signal of 2.116 GHz was uplinked to the spacecraft. As the spacecraft moves behind the limb of the planet, the signal penetrates deeper into the atmosphere. Refraction results in an increase in the Doppler shift and refractive defocusing, absorption, and scattering cause a decrease in the signal power. A limb tracking maneuver is also required of the spacecraft during this period to keep the antenna focused on the uplink signal. Also, changes in polarization of the signal occur in the atmosphere. All these data can be related to the refracting and absorbing properties of the atmosphere as a function of ray path penetration depth and inverted to give the temperature and pressure structure and the density of absorbing molecules in the atmosphere. Craft Data
|
|||||||||||||||||||||||||||||||||||||||||||||||||||||||
 The
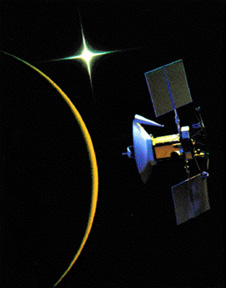
spacecraft consisted primarily of a large (3.7 m) high-gain antenna dish which
served the dual purpose of communications between the craft and Earth as well
as the science instrument for the SAR. The spacecraft was about 6.4 m long and,
with the solar panels extended, about 9.2 m across.
The
spacecraft consisted primarily of a large (3.7 m) high-gain antenna dish which
served the dual purpose of communications between the craft and Earth as well
as the science instrument for the SAR. The spacecraft was about 6.4 m long and,
with the solar panels extended, about 9.2 m across.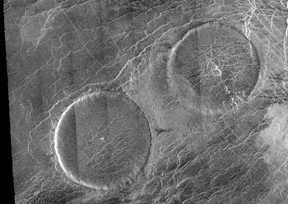 The
SAR operated at a frequency of 2.385 GHz with a pulse length of 0.0265 ms and
a peak output of 325 W. In radar mode, the resolution of the instrument was about
150 m. The resolution of the altimeter was 30 m and the accuracy of the radiometer
was 2 K.
The
SAR operated at a frequency of 2.385 GHz with a pulse length of 0.0265 ms and
a peak output of 325 W. In radar mode, the resolution of the instrument was about
150 m. The resolution of the altimeter was 30 m and the accuracy of the radiometer
was 2 K.