|
|
|
Hertzsprung-Russell Diagram Samples
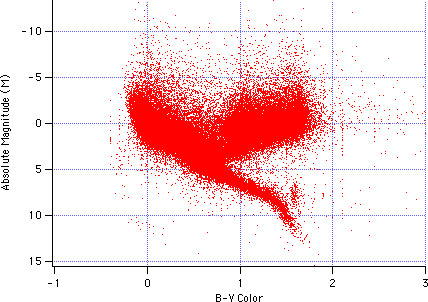
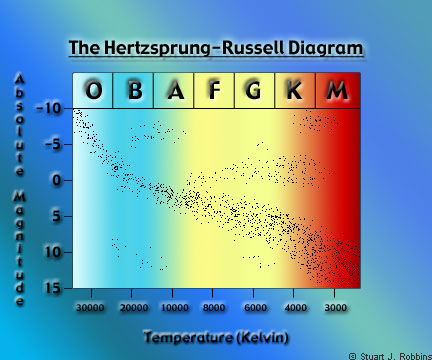
Overview There are many different "types" of H-R Diagrams. Except for one, all are secondary, for they show derived characteristics rather than the properties of stars one can directly measure. True H-R Diagram For H-R Diagrams, the only aspects of stars that are able to be measured are the magnitude and the B-V* value. The diagram to the right is a primary one. The absolute magnitude of these stars is known because their distances were precisely measured using a European sattelite, Hipparcus. The diagram to the left is made using the entire Hipparcus catalogue - 118134 stars. Still, the Main Sequence is very well-defined as is the giant branch. Dwarf stars are also visible. The apparent linearity of some data points is an artfact of the way it was recorded and the accuracy to which it was taken. *B-V refers to the difference in brightness of a star in two different filters - B (blue) and V (visual ~ yellowish-green) as defined using the Johnson system. The basis for the scale here is that the star Vega and about six other stars determined to be most-like Vega are averaged, and the average is defined as 0 in all color filters. Calculated The diagram at the right is a valid H-R Diagram, but it does not look at all like the original one. My version represents secondary data -- when astronomers study a star, they cannot directly measure the temperature nor the real brightness. Based upon the distance to the star and upon the type of light emitted, astronomers are able to determine these values and many other characteristics that are of interest to both the scientists and public. To digress, the method to deterine the absolute magnitude is through the so-called "distance modulous," which is the equation below:
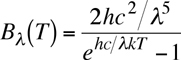
If both the apparent magnitude and the distance to a star are known, then one can use this equation to determine the absolute magnitude - the brightness of the star as it would appear at a distance of 10 parsecs. The method of temperature determination is somewhat more difficult. The color of the star, which can be determined by taking different images of the star at various wavelengths (hence the B-V in the first section), can be used. This is because every object at a given temperature emits a characteristic distribution of energy, which is given by the Planck Curve:
As you can see by this, the temperature of a body - in this case a star - determines where the peak wavelength will be. For an object the temperature of the sun - about 5780 K - the peak emission is at about 5014 Å, or green light. If the relative intensity of the star is known at several different wavelenghts, then a Planck Curve can be fit and the approximate temperature determined. For more discussion of this as well as a plot of the sun's curve, visit the Sun as Our Star page.
|