|
|
|
The Sun
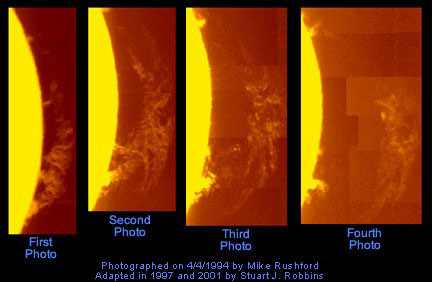
Overview The sun might look like an unchanging object in the sky, yet it is far from a simple ball of glowing plasma. This page explores many of the physical phenomena of the sun. Solar Flares Solar flares are huge outbursts of solar material, which are several thousand to million kilometers long. If we had some way of capturing all the energy emitted in one of the smallest solar flares, we would have enough energy to power the Earth for 1,000,000 years. The series of photographs at the right shows the progression of at least two flares. The main one is at the bottom with material stretching upwards in the first photo. By the fourth photograph, it has mostly dissipated, with the ejected material drifting outwards in space. The other flare is much smaller, and is near the top of the first photo. By the fourth photo, it can be seen ejecting material. Filaments and Prominences
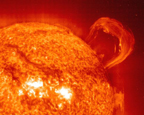
Filaments and prominences can remain relatively quiet and stable for days or weeks, but as the magnetic fields that support them change, they tend to erupt and rise off the sun over the course of a few minutes to hours. These are thousand to millions of kilometers wide and tall. Coronal Mass Ejection (CME) Coronal Mass Ejections (CME's) are giant bubbles of gas whose structures are dictated by magnetic field lines that are ejected from the sun over the course of a few hours. Even though the corona has been viewed for thousands of years via solar eclipses, CME's were not known about until the space age. Observations of the sun made with a coronagraph - a device that blocks the sun's disk from a detector - on the 7th Orbiting Solar Observatory (OSO 7) between 1971-1973 were the first evidence of CME's. The reason that ground-based coronagraphs won't work is because only the innermost parts of the corona can be seen against the brightness of the sky. Solar eclipses offer only a few minutes at best of the corona, which is too short of a time period to see the evolution of a CME. CME's disrupt the flow of the solar wind and can produce intense electromagnetic disturbances that can severely damage satellites and disrupt power grids on Earth. The frequency varies with the sunspot cycle; during solar minimum they come at a rate of about one per week, and during maximum there is an average of about two or three per day. Spicules Spicules are little-understood yet very common features of the photosphere. They appear as small, sharp, jet-like spikes of material, throughout the chromosphere. They tend to last only a few minutes, but in the process they eject material off into the corona at speeds of 20-30 km/s. In the image to the right, they can be seen as the "fur" on the surface of the sun. Sunspots
They were first discovered in ancient times. In 1610, Galileo Galilei became the first European to observe them. Daily observations began at the Zurich Observatory in 1749 and continuous observations between several observatories were started in 1849. They were not found to be caused by abnormal magnetic fields until 1908, by George Ellery Hale. The "sunspot number" (SSN) is calculated by counting he number of sunspot groups, then the number of individual spots, and the SSN is given as the sum of the number of individual spots plus ten times the number of groups. Sunspots have an eleven-year activity cycle that coincides with a 22-year pole complete magnetic pole flip of the sun *. When sunspots are at their peak, the sun actually becomes brighter. This is because magnetically brighter areas surround each sunspot, more than making up for the dimmer areas. They peaked last in 2001, and had their last big dip in 1995. If you own a telescope and a solar filter, you should see a decreasing amount of sunspots right now, with the next peak in 2012. No one yet has a generally accepted theory as to why the sun has this "internal clock."
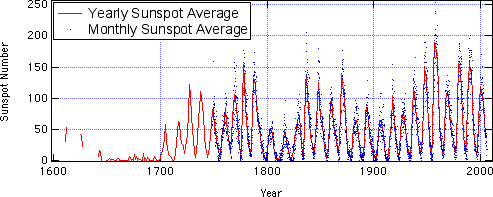
The diagram above depicts sunspot records dating back over 400 years. The data displayed are through September 2005 for the montly values, and through 2004 for the yearly average. It plainly shows that along with the eleven-year sunspot cycle, there appears to be a dramatic 70-year minimum where sunspot activity was nearly non-existant. This period between 1645 and 1715 is known as the "Maunder Minimum," and it is sometimes referred to as the "Little Ice Age." During this period, rivers that were normally ice-free froze and snow fields remained year-round in lower altitudes. Evidence of similar periods of solar inactivity are present in radioactive carbon-14 from 8000-year-old trees. There are also periods of increased activity, the last one occurring in the twelfth century (timely sunspot records do not exist that far back, so they are not displayed). These periods can last for over 200 years.
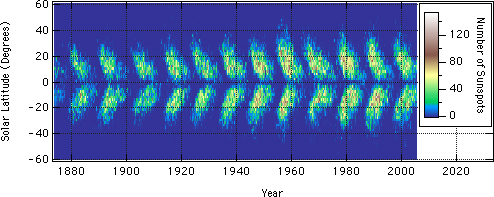
Another interesting phenomena of sunspots is shown in the above graph, known as the "Butterfly Diagram." To create it, I used daily sunspot information for May 1874 (earlier data were not available) through September 2005, that contains data of the location of sunspots on the solar disk. I then binned this information into 3-month temporal bins and 2° latitude bins. The color indicates the number in each bin. The result depicts the intensity of sunspots on the sun throughout the sunspot cycles. So, the sunspot lows are not only characterized by few spots, but also by sunspots concentrated near the equatorial regions. As the cycle approaches maximum, the spots jump closer to the poles, and then they gradually spread back to the equator as the cycle reaches another minimum. *The sun's magnetic pole reverses its polarity every 11 years, and this cycle is associated with the sunspot cycle. This means that for a truly complete sunspot / magnetic field cycle, one must wait 22 years. Helioseismology Besides all of the before-mentioned deviations of the sun from the Greek idealized orb, the sun actually oscillates like a gong. patches of the surface of the sun oscillate up and down with a period ranging of around 5 minutes (1/300 Hz). Discovered in 1962, these were poorly understood for almost a decade. They appear to be mostly a radial - inward and outward - motion of the surface. A network of satellites collectively called the GONG (Global Oscillation Network Group) monitor this seismic activity. The source of these 5-minute oscillations found theoretical framework in 1970 and observational confirmation in 1975. The oscillations seen on the surface are due to sound waves that are generated and trapped inside of the sun, produced by pressure fluctuations in the convection zone. As the waves move outward, they reflect off the photosphere where the density and pressure decrease rapidly. Inward moving waves are refracted by the increase in the speed of sound as the temperature increases and eventually return to the surface. The trapped sound waves set the sun vibrating in millions of different modes. Since sound is produced by pressure, the modes of vibration are called "p -modes." The sound waves and the modes of vibration that are produced can be used to learn more about the interior of the sun in the same way that geologists use earthquakes to learn more about Earth's interior. Helioseismologists can use the properties of the waves to determine the temperature, density, composition, and motion of the interior of the sun. One recent discovery was that the different rotation rates between the equator and the poles is confined to the upper layers of the sun, and it disappears near the base of the convection zone. Magnetic Field Variations The sun's magnetic field typically averages 1-2 Gs, but it fluctuates over a much higher range at various phenomena:
|
 Filaments
are dark, thread-like features that are seen in red light (H-
Filaments
are dark, thread-like features that are seen in red light (H-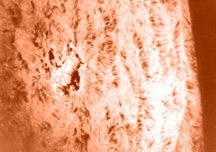
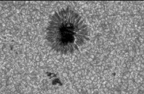 Sunspots
are cooler areas of the sun's photosphere. They also have very strong magnetic
fields, up to 10,000 times that of Earth's - up to 3000 times that of the rest
of the sun, and current sunspot theory holds that that it is the magnetic fields
that cause the sunspots. Sunspots usually occur in groups of approximately 10,
and the individual spots can be as large as the planet Earth. They are usually
about 5,000 K (8,500 °F), which is 800 K (1,500 °F) cooler than the rest
of the photosphere.
Sunspots
are cooler areas of the sun's photosphere. They also have very strong magnetic
fields, up to 10,000 times that of Earth's - up to 3000 times that of the rest
of the sun, and current sunspot theory holds that that it is the magnetic fields
that cause the sunspots. Sunspots usually occur in groups of approximately 10,
and the individual spots can be as large as the planet Earth. They are usually
about 5,000 K (8,500 °F), which is 800 K (1,500 °F) cooler than the rest
of the photosphere.