|
|
|
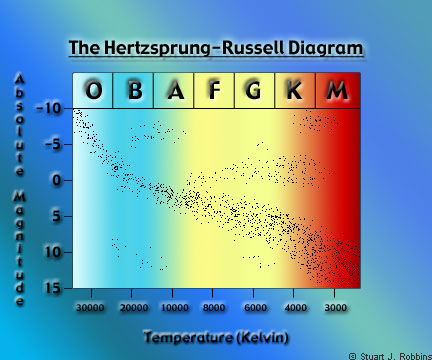
Hertzsprung-Russell Diagram Overview Scientists have discovered many different kinds of stars -- from dwarfs to supergiants, from main sequence to cepheids. But up until the early 1900's, there was no general way to classify them. That all changed with the invention of the Hertzsprung-Russell Diagram, which has become one of the most important tools in stellar astronomy. This page is a simple explanation of the H-R Diagram; for a much more-complete discussion, please see the Advanced version of this web site. What It Is Independently, Danish astronomer Ejnar Hertzsprung and American astronomer Henry Norris Russell discovered that when they compared the luminosity with the type of light that was observed from stars, there were many patterns that emerged. In 1905, Hertzsprung presented tables of luminosities and star colors, noting many correlations and trends. In 1913, Russell published similar data in a diagram. It is now called the Hertzsprung-Russell Diagram in honor of these two pioneers. The diagram at the right is a valid H-R Diagram, but it does not look at all like the original one. My version represents secondary data -- when astronomers study a star, they cannot directly measure the temperature nor the real brightness. Based upon the distance to the star and upon the type of light emitted, astronomers are able to determine these values and many other characteristics that are of interest to both the scientists and public. Patterns Russell noticed that almost 90% of the stars fell along a diagonal ribbon that stretched from the top-left to the bottom-right of his diagram. The stars that fell into this diagonal ribbons were classified as the Main Sequence, of which our sun is a member. They also noticed that other groups of stars became evident. Those included blue supergiants in the upper-left, red supergiants in the upper-right, white dwarfs in the lower-left, red dwarfs in the lower-right, red giants and cepheid variables in the middle-right (the branch extending from the main sequence). Other Developments Other attributes of the Diagram are the Spectral Classifications: O, B, A, F, G, K, M. These are used by astronomers as basic categories into which the stars can be placed, for all stars within a spectral class share some very basic characteristics. For example, if I were to tell you that the sun was a type G star, you would know that it had a temperature of around 6000 K, a color of yellow, and an absolute magnitude of around +5. In actuality, the sun has a temperature of about 5,800 K, is yellow, and has a magnitude of +4.85*. First developed in 1919, the H-R Diagram has been refined over the years and other sub-categories have been added. To date, no one has developed a good mnemonic way to recall the order of spectral classes. Supposedly, there was once an astronomy professor who challenged his students: If anyone could think of a good way to remember the order of the spectral classes, they would get an A in the class without having to turn in any work or take any exams. No one could come up with a good one. The best to date (that I am aware of) is as follows: Oh, Be A Fine Girl/Guy - Kiss Me! *This is the sun's absolute magnitude, as opposed to its apparent magnitude. The Sun's apparent magnitude is -26.87. Apparent magnitude is a measure of how bright a star is from our vantage point here on Earth. The absolute magnitude is what the star's magnitude would be if it were viewed from a distance of 10 parsecs (approximately 33 light-years).
|