Lunar Prospector (1998-1999)
Early Unmanned NASA Craft | Mercury |Gemini | Apollo | Clementine |
Lunar Prospector | Hubble Space Telescope

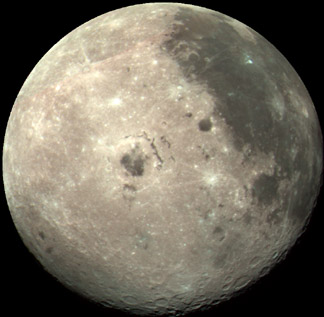
The Lunar Prospector was designed for a low polar orbit investigation
of the moon, including mapping of surface composition
and possible deposits of polar ice, measurements of magnetic and gravity fields,
and study of lunar outgassing events.
Data from the 19 month mission allowed construction of a detailed
map of the surface composition of the moon, and improved our understanding of
the origin, evolution, current state, and resources of the moon.
The spacecraft carried 6 experiments: A Gamma Ray Spectrometer,
Neutron Spectrometer, Magnetometer, Electron Reflectometer, Alpha Particle Spectrometer,
and a Doppler Gravity Experiment. The instruments were omnidirectional and required
no sequencing. The normal observation sequence was to record and downlink data
continuously.
The Lunar Prospector mission was the third mission selected
by NASA for full development and construction as part of NASA's Discovery Program.
Total cost for the mission was $62.8 million including development ($34 million),
launch vehicle (~$25 million) and operations (~$4 million).
Following launch on January 7, 1998 UT aboard a three-stage
Athena 2 rocket, the Lunar Prospector had a 105-hour cruise to the moon. During
the cruise, the three instrument booms were deployed. The MAG and APS collected
calibration data, while the GRS, NS, and ER outgassed for one day, after which
they also collected calibration data in cis-lunar space.
The craft was inserted into an 11.6-hour period capture orbit
about the moon at the end of the cruise phase. After 24 hours Lunar Prospector
was inserted into a 3.5-hour period intermediate orbit, followed 24 hours later
(on January 13, 1998) by transfer into a 92x153 km preliminary mapping orbit,
and then on January 16 by insertion into the near-circular 100 km altitude nominal
lunar polar mapping orbit with an inclination of 90° and a period of 118
minutes.
Lunar calibration data was collected during the 11.6- and 3.5-hour
orbits. Lunar mapping data collection started shortly after the 118 minute orbit
was achieved. The data collection was periodically interrupted during the mission
as planned for orbital maintenance burns, which took place to re-circularize
the orbit whenever the periselene or aposelene was more than 20 to 25 km from
the 100 km nominal orbit - about once a month. On December 19, 1998, a maneuver
lowered the orbit to 40 km to perform higher resolution studies.
The orbit was altered again on January 28, 1999, to a 15x45
km orbit, ending the 1 year primary mission and beginning the extended mission.
The mission ended on July 31, 1999, at 9:52:02 UT (5:52:02 EDT) when Lunar Prospector
was deliberately targeted to impact in a permanently shadowed area of a crater
near the lunar south pole. It was hoped that the impact would liberate water
vapor from the suspected ice deposits in the crater and that the plume would
be detectable from Earth, however, no plume was observed.
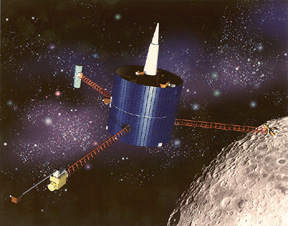 The
spacecraft was a graphite-epoxy drum, 1.37 m in diameter and 1.28 m high with
three radial 2.5 m instrument booms. A 1.1 m extension boom at the end of one
of the 2.5 m booms held the magnetometer. It was spin-stabilized (nominal spin
rate 12 rpm) with its spin axis normal to the ecliptic plane. The spacecraft
was controlled by 6 hydrazine monopropellant 22-N thrusters, two aft, two forward,
and two tangential. Three fuel tanks mounted inside the drum held 138 kg of hydrazine
pressurized by helium. The power system consisted of body mounted solar cells
which produced an average of 186 W and a 4.8 A-hr rechargeable NiCd battery. The
spacecraft was a graphite-epoxy drum, 1.37 m in diameter and 1.28 m high with
three radial 2.5 m instrument booms. A 1.1 m extension boom at the end of one
of the 2.5 m booms held the magnetometer. It was spin-stabilized (nominal spin
rate 12 rpm) with its spin axis normal to the ecliptic plane. The spacecraft
was controlled by 6 hydrazine monopropellant 22-N thrusters, two aft, two forward,
and two tangential. Three fuel tanks mounted inside the drum held 138 kg of hydrazine
pressurized by helium. The power system consisted of body mounted solar cells
which produced an average of 186 W and a 4.8 A-hr rechargeable NiCd battery.
Communications were through two S-band transponders, a slotted,
phased-array medium gain antenna for downlink, and an omnidirectional low-gain
antenna for downlink and uplink. There was no on-board computer, all control
was from the ground, commanding a single on-board command and data handling unit.
Data were downlinked directly and also stored on a solid-state recorder and downlinked
after 53 minutes, to ensure all data collected during communications blackout
periods were received.
Gamma Ray Spectrometer (GRS)
- This experiment was to provide global maps of elemental abundances on the
lunar surface. The GRS was designed to record the spectrum of gamma rays emitted
by the radioactive decay of elements contained in the moon's crust and elements
in the crust bombarded by cosmic rays and solar wind particles. The most important
elements detectable by the GRS are uranium (U), thorium (Th), and potassium
(K), radioactive elements which generate gamma rays spontaneously, and iron
(Fe), titanium (Ti), oxygen (O), silicon (Si), aluminum (Al), magnesium (Mg),
and calcium (Ca), elements which emit gamma rays when hit by cosmic rays or
solar wind particles.
- The uranium, thorium, and potassium, in particular were used to map the location
of KREEP (potassium, rare-earth element, and phosphorus containing material,
which is believed to have developed late in the formation of the crust and upper
mantle, and is therefore important to understanding lunar evolution.) The GRS
was also capable of detecting fast (epithermal) neutrons, which complemented
the NS in the search for water on the moon.
- The GRS was a small cylinder which will be mounted on the end of one of the
three 2.5 m radial booms extending from the Lunar Prospector. It consisted of
a bismuth germanate crystal surrounded by a shield of borated plastic. Gamma
rays striking the bismuth atoms produced a flash of light with an intensity
proportional to the energy of the gamma ray which was recorded by detectors.
The energy of the gamma ray is associated with the element responsible for its
emission. Due to a low signal to noise ratio, multiple passes were required
to generate statistically significant results. At nine passes per month, it
took about three months to confidently estimate abundances of thorium, potassium,
and uranium, and 12 months for the other elements. The precision varies according
to element measured. For U, Th, and K, the precision is 7% to 15%, for Fe 45%,
for Ti 20%, and for the overall distribution of KREEP 15% to 30%. The borated
plastic shield was used in the detection of fast neutrons. The GRS achieved
global coverage from an altitude of approximately 100 km and with a surface
resolution of 150 km.
Neutron Spectrometer (NS)
- This was designed to detect minute amounts of water ice which may exist on
the moon. It could detect water ice at a level of less than 0.01%. The moon
has a number of permanently shadowed craters near the poles with continuous
temperatures of -190° C. These craters may act as cold-traps of water from
incoming comets and meteoroids. Any water from these bodies which found its
way into these craters could become permanently frozen. The NS was also used
to measure the abundance of solar wind implanted hydrogen.
- The NS was a thin cylinder colocated with the APS at the end of one of the
three radial Lunar Prospector science booms. The instrument had a surface resolution
of 150 km. For the polar ice studies, the NS examined the poles to 80° latitude
with a sensitivity of at least 10 ppm of hydrogen. For the implanted hydrogen
studies, the NS examined the entire globe with a sensitivity of 50 ppm.
- The NS consisted of two canisters each containing helium-3 and an energy
counter. Any neutrons colliding with the helium atoms gave an energy signature
which was detected and counted. One of the canisters was wrapped in cadmium
and one in tin. The cadmium screened out thermal (low energy or slow-moving)
neutrons while the tin did not. Thermal neutrons are cosmic-ray generated neutrons
which have lost much of their energy in collisions with hydrogen atoms. Differences
in the counts between the two canisters indicated the number of thermal neutrons
detected, which in turn indicated the amount of hydrogen on the moon's crust
at a given location. Large quantities of hydrogen would be due to the presence
of water.
Alpha Particle Spectrometer (APS)
- This was designed to detect radon outgassing events on the surface of the
moon. The APS recorded alpha particle signatures of radioactive decay of radon
gas and its daughter product, polonium. These putative outgassing events, in
which radon, nitrogen, and carbon dioxide are vented, are hypothesized to be
the source of the tenuous lunar atmosphere, and
may be the result of the low-level volcanic/tectonic activity on the moon. Information
on the existence, timing, and sources of these events will help in a determination
of the style and rate of lunar tectonics.
- The APS was a cube approximately 18 cm on a side colocated with the NS on
the end of one of the three radial 2.5 m Lunar Prospector science booms. It
contained ten silicon detectors sandwiched between gold and aluminum disks arranged
on five of six sides of the cube. Alpha particles, produced by the decay of
radon and polonium, leave tracks of charge on silicon wafers when they impact
the silicon. A high voltage is applied to the silicon, and the current is amplified
by being funneled along the tracks to the aluminum disk and is recorded for
identification. The APS made a global examination of gas release events and
polonium distribution with a surface resolution of 150 km and a precision of
10%.
Doppler Gravity Experiment (DGE)
- This was designed to learn about the surface and internal mass distribution
of the moon. This was accomplished by measuring the doppler shift in the S-band
tracking signal as it reaches Earth, which can be converted to spacecraft accelerations.
The accelerations can be processed to provide estimates of the lunar gravity
field, from which the location and size of mass anomalies affecting the spacecraft
orbit can be modeled. Estimates of the surface and internal mass distribution
give information on the crust, lithosphere, and internal structure of the moon.
- This experiment provided the first lunar gravity data from a low polar orbit.
Because line-of-sight tracking was required for this experiment, only the near-side
gravity field can be estimated using this doppler method. The experiment is
a by-product of the spacecraft S-band tracking, and so has no listed weight
nor power requirements. The experiment gave the near-side gravity field with
a surface resolution of 200 km and precision of 5 mgal in the form of spherical
harmonic coefficients to degree and order 60. The extended mission, in which
the spacecraft descended to an orbit with an altitude of 50 km and then to 10
km, improved on this resolution by a factor of 100 or more.
- The downlink telemetry signal was transmitted at 2273 MHz, over a ±1
MHz bandwidth as a right-hand circularly polarized signal at a nominal power
of 5 W and peak power of 7 W. Command uplinks were sent at 2093.0542 MHz over
a ±1 MHz bandwidth. The transponder was a standard Loral/Conic S-Band
transponder. An omnidirectional antenna could be used for uplink and downlink,
or a medium gain helix antenna could be used (downlink only).
- The spacecraft was spin-stabilized; the spin resulted in a bias in the doppler
signal due to the spacecraft antenna pattern spinning with respect to the Earth
station of 0.417 Hz (27.3 mm/sec) for the omnidirectional antenna, and -0.0172
Hz (-1.12 mm/sec) for the medium gain antenna. LOS data was sampled at 5 sec
to account for the approximately 5 second spin rate of the spacecraft, leaving
a residual of less than 0.1 mm/sec.
Magnetometer (MAG)
- This was be used primarily to map weak lunar magnetic fields. There is no
global lunar magnetic field, but regional crustal magnetic fields do exist.
These may be paleomagnetic remnants of a former global magnetic field, or may
be due to meteor impacts or other local phenomena. It is hoped that a map of
the location and strengths of these fields will provide information on their
origin. The experiment also may allow estimates of the size and composition
of the lunar core and provide information on the lunar induced magnetic dipole.
- The magnetometer was located on the end of one of the three radial Lunar
Prospector booms, on a 0.8 meter pole extending from the ER. It was 2.6 m from
the Lunar Prospector in order to isolate it from spacecraft generated magnetic
fields. It was a triaxial fluxgate magnetometer similar in design to the instrument
used on Mars Global Surveyor. The MAG measured
the magnetic field amplitude and direction at spacecraft altitude with a spatial
resolution of about 100 km when ambient plasma disturbances were minimal.
Electron Reflectometer (ER)
- This was designed to collect information on the lunar remnant paleomagnetic
fields. The ER measured the energy spectrum and direction of electrons. This
information was used to determine the location and strength of magnetic fields.
The moon has no global magnetic field, but does have weak localized magnetic
fields at its surface. This experiment helped to map these fields and provide
information on their origins, allow possible examination of distribution of
minerals on the lunar surface, and aid in a determination of the size and composition
of the lunar core.
- The ER and the electronics package were located at the end of one of the
three radial science booms on Lunar Prospector. The ER worked by measuring the
pitch angles of solar wind electrons reflected from the moon by lunar magnetic
fields. Stronger local magnetic fields can reflect electrons with larger pitch
angles. The ER measured field strengths as small as 0.01 nT with a spatial accuracy
of about 3 km at the lunar surface.
|
| Launch Date |
January 7, 1998 at 02:28:44 UTC |
| Launch Vehicle |
Athena II
|
| Mass |
296 kg (158 kg dry) |
| Power System |
Body mounted 202 W solar cells and 4.8 A-hr NiCd battery |
|
| Experiments: |
Name
|
Mass (kg)
|
Power Consumption (W)
|
Principal Investigator
|
| Gamma Ray Spectrometer (GRS) |
8.6
|
3
|
Mr. G. Scott Hubbard |
| Neutron Spectrometer (NS) |
3.9
|
2.5
|
Dr. William C. Feldman |
| Alpha Particle Spectrometer (APS) |
4
|
7
|
Dr. Alan B. Binder |
| Doppler Gravity Experiment (DGE) |
|
|
Dr. Alexander Konopliv |
| Magnetometer (MAG) |
5
|
4.5
|
Dr. Lonnie L. Hood |
| Electron Reflectometer (ER) |
Prof. Robert P. Lin |
|